It was during my undergraduate course, I was awestruck by the idea that Information is quantifiable. Until then information for me was an abstract term. It still would have been, if not in the realm of information storage, transmission and retreival.
As a layman we associate the term information to various contexts - text content of books and newspapers, videos from news rooms, speech from telephonic conversations, audio podcasts etc- all contains information. I should not forget to mention that we exchange information in our daily chit-chats too.
What attracts us to a source of information - a new book, a conversation or a video? It is either the novelty of the content or the way of presentation. The former is what I call the information content of the source. It surprises you with new ideas. The latter is an element of art that charms you to read a book, listen to a conversation or watch a video. But my concern in this writeup would of course be the first aspect, that helps you quantify or measure information. A news room debate may be heavily engaging and tempting to listen, but every participant would be just stating the obvious. Would you consider that debate informative? The answer is a big NO!!
What is Information?
So far I have used the term information in a very loose sense. But when it comes to mathematical quantification, it has to be very binding. Even in the loose sense, it is meaningful to think a source is highly informative if it is giving out less probable or surprising outputs.
The text content of a newspaper article would just be a sequence of alphabets. But just imagine what diverse realms of knowledge can be depicted in English with just the permutations of the 26 alphabets!! The entire information content of that article can be considered to be built up of the information contributed by each alphabet. If that idea did surprise you, I am happy that I just transferred a hell lot of information to you.
A Simple Information Source
But it is difficult to explain how to measure the information contained in an abstract idea. So let me redefine the scope of the term source of information. Suppose there is a coin tossing machine. It tosses a fair coin in secret and lets you know the result by writing out a H and T for a Head and Tail respectively. This machine is a source of information. The result of the toss is unknown beforehand and there is an absolute uncertainity. The message written out H or T does carry some information to the outside world. If the machine continuously tosses and reports the result, there would be a sequence of Hs and Ts flowing out. Machine reporting an output is equivalent to someone reporting the result of a cricket match in a news article. The entire sequence of Hs and Ts contain information about the result of all tosses. On repeating the experiment many times you can expect approximately and equal number of Hs and Ts in your sequence. The information present in the sequence is equally distributed among the alphabets H and T.
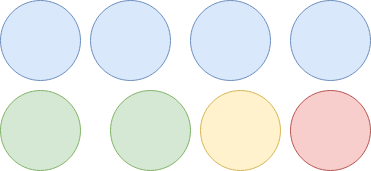
Now let us expand the secret experiment of coin toss. Our new information source is a machine that randomly picks up a button in secret from a group of eight buttons - 4 blue, 2 green, 1 yellow and 1 red - and reports the colour. As in the previous case, instead of stating the color explicitly just share an agreed symbols B-blue, G-green, Y-yellow, R-red. If the secret pick experiment is repeated many number of times and the results are reported, we get a sequence, say BBYGBBRGGBBGYRBGBB.
In this particular case I can expect a half of the sequence would be Bs, a quarter would be Gs and one-eighth each would be Ys and Rs. That would hardly need any explanation. This is indicated in the folowing probability table.
P(B) = 1/2 =0.5
P(G) = 1/4 = 0.25
P(Y) = 1/8 = 0.125
P(R) = 1/8 = 0.125
Since B is a highly probable outcome, its occurance would not induce much surprise in you. In other words, among the symbols B, G, Y and R - B has the least information content in it. Y and R being the least probable outcomes, their occurance would be more surprising and hence contain more information. The information content in a source symbol is infact inversely realted to its probability of occurance.
But what is Entropy?
Before quantifying this information let us agree on some unit to represent it. Let us choose binary digits (0 and 1) as the symbols to represent the outcome of any information source. That is instead of H and T use 0 and 1. To convey the outcome of the coin tossing machine, you need one bit. If you repeat the coin tossing experiment 32 times, you will need 32 x 1 = 32 bits to represent the sequence of outcomes.
Instead of B, G, Y and R let us use the binary words 00, 01, 10 and 11 respectively. That is to tell the outcome of the button picking machine you need two bits. Repeating the button picking experiment 32 times would require 32 x 2 = 64 bits to indicate the sequence of outcomes.
Now the question is, can it be represented in a more compact way? What if I use 1 for B, 01 for G, 000 for Y and 001 for R? So now I need 1 bit to say Blue was chosen while 3 bits to say Yellow. The sequence of 7 outcomes BBYGBBR can be now written as 1 1 000 01 1 1 001, using just 12 bits. If it were the earlier scheme we would have needed 14 bits.
That sounds cool!! But what did we just do?
Instead of assigning equal length binary word to each symbol B, G, Y and R , we assigned shortest word of 1 bit length to the symbol B which contains the least amount of information and the longest word of 3 bits to the the symbols Y and R with the highest quantity of information. When you represent a large sequence of outcomes like BBYGBBRGGBBGYRBGBB in bits, this would reduce the total number of bits as we have exemplified above.
Why does it reduce the total number of bits?
It is because you have used the shortest word for the most frequently occuring symbol B and the longest word for the least occuring symbols Y and R.
If you have not noticed already, the length of word assigned to each symbol was infact the base 2 logarithm of the inverse of probability of occurance of each symbol. This number(the base 2 logarithm of the inverse of probability) is the information content of that particular symbol in bits. You can read that once again!!
Probaility of each symbol
P(B) = 1/2 =0.5
P(G) = 1/4 = 0.25
P(Y) = 1/8 = 0.125
P(R) = 1/8 = 0.125
Code word and Information content of each symbol. Information is Quantified in this step!!
Code for B = 1. The Information content of B is given by:
$ I (B)= log_2 {\frac{1}{0.5} }= 1 \ bit $
Code for G = 01. The Information content of G is given by:
$ I (G)= log_2 {\frac{1}{0.25} }= 2 \ bits $
Code for Y = 000. The Information content of Y is given by:
$ I (Y)= log_2 {\frac{1}{0.125} }= 3 \ bits $
Code for R = 001. The Information content of R is given by:
$ I ( R)= log_2 {\frac{1}{0.125} }= 3 \ bits $
Initially we had used equal length code for each symbol. So the average code word length was 2 bits. Now our code word is variable length, the length corresponding to the information contained in each symbol.
The average information content per source symbol is $ H(X)=\sum_{i=1}^n P(x_i) I(x_i) = 0.5 \times 1 bit + 0.25 \times 2bits + 0.125 \times 3bits + 0.125 \times 3 bits = 1.75 bits $ The term $ H(X) $ is the entropy of the source.
On an average you need only 1.75 bits (unlike 2 bits we assumed initially) per source symbol to represent the information emitted by the source. The colours are predictable to some extend and that reduces the uncertainity and thus the information contained in it. If all the four colours were equally likely, you would have needed same number of bits to represent each letter and that number would have been 2, ie. ($log_2\frac{1}{0.25}$)
Higher the entropy of a source, on an average we need more number of bits to represent a source symbol. In the example above the codeword length was same as the information content of that symbol. This is possible because the information defined by $ log_{2}(\frac{1}{P(x_i})$, happened to be integers. It need not always be the case. If it is not an integer, choose a code word length that is the next higher integer. Then the average codeword length would be higher than the entropy. A
Assigning a binary codeword to a symbol, that has a length (approximately) equal to the information contained in it is called entropy coding. A popular type of entropy coding is Huffman coding algorithm. Replacing every occurance of a symbol by its huffman code would essentially compress the content than it were represented by equal length codes.
This is infact an idea first proposed by Claude E.Shannon and the foundation for the theory of compression and communication. If you have observed the Morse code used in telegraphy, the same idea of assigning shortest code to most frequently occuring symbol can be seen.
Further, if you are really interested in the equation of entropy, check out the video in speech zone.
But the source need not always be the tossing machine!! Then how would I find the best code word length?
The source of information and its structure need not be known beforehand. You can always observe a large sequence of symbols emitted by a source and just count the number of times a particular symbol is repeated. Find the probaility of occurance of the symbol. Once you know the probability, you can find the information content associated with that symbol in bits. Averaging it over all symbols and their probabilities, would give you the entropy.
Shannon himself has tried to determine, the entropy of English language. If all the alphabets were equally likely, the entropy would have been $log_{2}(\frac{1}{\frac{1}{26}})=4.7 bits/ letter$. But on analysing English language, e is the most and q the least popular letters. Analysing the relative frequencies, he has reached the answer that the entropy is 4.14 bits/letter. The more we know about the statistical structure of a language, it becomes easily predictable and thus reduces the information content and thus the entropy.
The redundancy in a langauge can be further explored by considering the probability of a particular letter to follow another letter, and the entropy can be found to be still lower. From Shannon’s paper on Prediction and Entropy of Printed English
The redundancy,on the other hand, measures the amount of constraint imposed on a text in the language due to its statistical structure, e.g. in English the high frequency of the letter E, the strong tendency of H to follow T or of U to follow Q. It was estimated that when statistical effects extending over not more than eight letters are considered the entropy is roughly 2.3 bits per letter, the redundancy about 50 per cent
Entropy of Malayalam Script
Every scripted language has an inherent structure that makes certain character sequences valid words. A probability modelling of the alphabets of the language with respect to the relative frequency of occurance of the alphabets can be done by analysing huge text corpora of that language. An experiment to determine the entropy of Malayalam script is elaborated next.
I extracted a subset of Malayalam sentence corpora maintained by Swathanthra Malayalam Computing. Regular Malayalam text content has English alphabets occuring ocassionally.
Then the following python script was used to filter out English and retain only those characters relevant to Malayalam. The relevant list of alphabets consist of all the Malaylam vowels(അ, ആ ..), consonants(ക, ച, ട…), vowel signs(ാ, ി…), Arabic numerals (0-9) and basic punctuations including space and newline characters .
A part of the sentance corpora consisting of curated content extracted from newspaper articles, blogposts etc. in textcorpus directory was filtered and the resulting content was placed in result directory as a single textfile malayalam.txt using the following shell script.
cat ./textcorpus/*.txt | python malayalam-filter.py > result/malayalam.txt
Now it is time for relative frequency analysis on malayalam.txt. Python libraries numpy, scipy and huffman helps in the statistical analysis and the code below is self explanatory.
On analysing 543865 characters, the resulting entropy is 4.944 bits/character. The result as given by the above script is as below:
The number of characters parsed 543865
Total number of unique characters: 82
writing content to character frequency table
The entropy is: 4.9443809924853666
writing content to huffman codebook
If you are curious to see the relative frequency of each characters, have a look at the character frequency table:
You can see for yourself ് is the most frequent character in Malayalam script and ഋ is the least occuring one.
Now if you apply Huffman encoding, the most frequent character will get the binary code-word of least length. See for yourself the huffman code for each of the above characters.
് has a 3 bit code word while ഋ has a 17 bit code word. You can experiment for youself by changing the corpora, and find out the corresponding entropies and binary codewords. On expanding the corpora by including the Malayalam wikipedia articles, I got an entropy of 5.024 bits/characters.
Infact there has been prior attempts in this regard for Malayalam and the details can be found in the following academic papers.
- “Entropy of Malayalam Language and Text Compression Using Huffman Coding”, Melbin Kuruvila, Deepa P. Gopinath, 2014 First International Conference on Computational Systems and Communications (ICCSC)
It reports an entropy of 4.8 bits per character. The difference might have been caused by the choice of corpora.
- “Malayalam text Compression”, Sajilal Divakaran, Biji C. L., Anjali C., Achuthsankar S. Nair, International Journal of Information System and Engineering, 2013
It reports an entropy of 5.47 bit per character. But the characters chosen are not the atomic characters, but mostly consonant conjuncts and that has made a difference.
What does that mean, if Malayalam has an entropy of 4.944 bits/letter?
In the simplest terms it indicate the limit to which you can compress Malayalam text content. If you have a text of 1000 characters in Malayalam, it would follow a probability distribution as indicated by the character frequency table. You can replace every character by the huffman code we derived above and the total number of bits you need to represent those 1000 characters would be approximately 4.944 bits/letter x 1000 = 4944 bits. But inorder to recover the original text you will have to look-up a huffman code table.
Representing a 1000 character text in Malayalam in Unicode encoding would have costed you 1000 x 24 bits = 24000 bits !! Remember every Malayalam unicode character takes 3 bytes of memory.
To wind up, there are still more possibilities to explore towards the statistical nature of the Malayalam text. There are restrictions like a vowel can never occur in a valid Malayalam word, unless it is at the start of the word. Such properties can be extracted from the N-gram character probalility modelling of Malayalam and the corresponding entropy would be smaller and can help you reach better compression.
That is all for now. Thanks for reading 😊